

How to build a “Canary” for your portfolio
In 1896 an engineer by the name of John Haldane invented a bird cage for canaries to be carried into mines. The cage handle was equipped with a canister of oxygen that was able to be deployed by closing the cage windows. This allowed the miners to carry their canaries into the mines to help identify the risk of carbon monoxide (CO) and to revive them as they made their way out of the tunnel. If the canary became weak or fell over, it indicated that CO levels were high, and miners would exit the mine.
The use of canaries for the safety of the miners was in full use by the early 1900s and stayed as the early warning sign until 1986 when laws were passed to allow only mechanical devices in the mines to detect high levels of CO.
Canaries, it turns out, are more sensitive to CO than mice or other animals. You can imagine the importance of the canary to alert for potential risk. Great for the mines but not so great for investing.
Investors are looking for ways to alert them to potential risks for investing. So, what is a good “Canary” for investing? We have found that High Yield bonds, often referred to as junk bonds, are extremely sensitive to liquidity and are a good indicator of potential danger (weakness) in the investment markets.
What are high yield bonds?
We have identified high yield corporate bonds as the type of bond that is most sensitive to economic and liquidity issues. Credit rating services identify the creditworthiness of a corporation and rank those companies based on their current financial stability. Those companies that have a low rating are classified as higher risk when they issue their bonds. Typically, those bonds will have a higher yield attached to them to compensate the investor for the added risk of potential default.
If the economy begins to weaken, high yield corporate bonds tend to decline in price since those companies are likely to have an increased risk of not being able to pay their interest when due. There is also the risk that the company may file for bankruptcy and not pay the bondholders on the maturity of their bonds.
There are services that build an “Index” that is comprised of 100’s of high yield corporate bonds. Since these bonds are not traded as frequently as quality corporate or treasury bonds, they tend to have less daily volatility. Lower volatility allows the “Index” to trend more smoothly than other markets or other market indexes. Building a moving average around the High Yield bond index allows one to see when the trend is up (positive for stocks) or if it is reversing and moving lower (negative for stocks).
How to measure a trend
We prefer to use an Exponential Moving Average (EMA) since it gives more weight to recent data. When constructing the EMA you can use any number of days, the number of days you use determines how fast the index value moves above and below the EMA. When high yield bonds move above their specific EMA, stocks are likely to move higher. When high yield bonds move below their specific EMA, stocks are likely to move lower.
Part II - how to build a “canary”
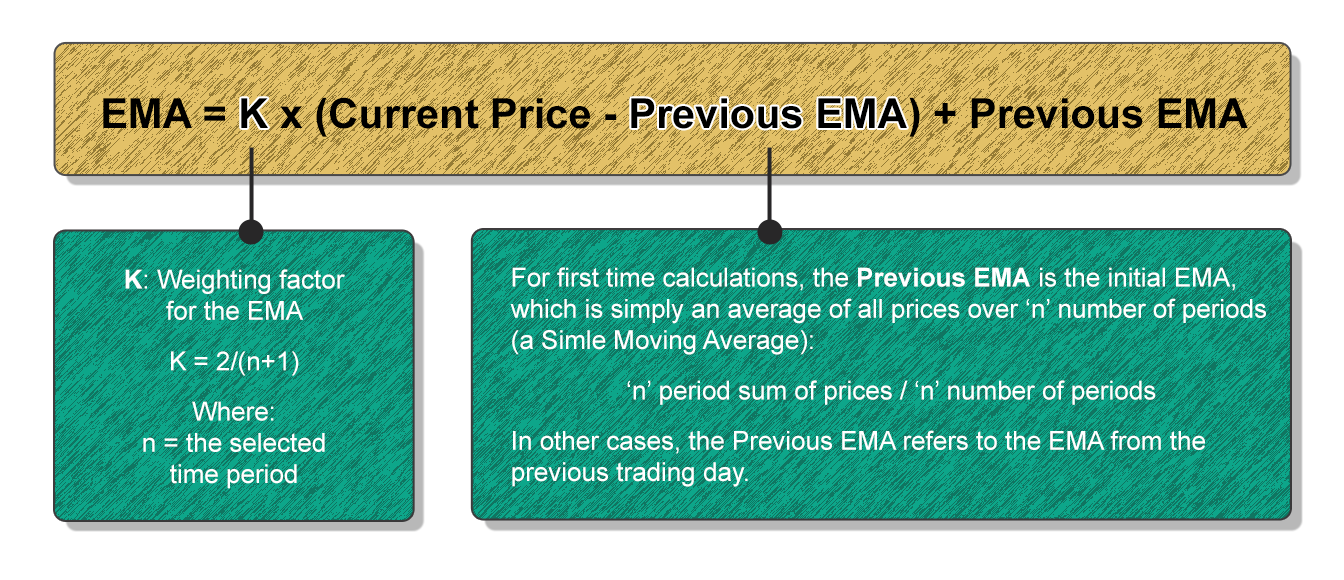
In Part 1 we ended with an explanation of how we measure a trend. We explained that we prefer to use an Exponential Moving Average (EMA) since it gives more weight to recent data. When constructing the EMA you can use any number of days, the number of days you use determines how fast the index value moves above and below the EMA. When high yield bonds move above their specific EMA, stocks are likely to move higher. When high yield bonds move below their specific EMA, stocks are likely to move lower. To calculate an EMA of any length, use the following formula:
What about other types of bonds? Aren’t all bonds similar?
Bonds are extremely different from each other in yield and price direction. High yield Bonds can be classified as Corporate or Municipal and while they are both considered high yield they often move in opposite directions. In this case, we construct a model for each of those two high yield categories and they trade on their own model.
US Government, or Treasury, Bonds are considered to be the safest bonds to invest in since the Government is the guarantor of both the payment of interest and principal. Similar to other bonds, Government bonds can be purchased in a wide range of months or years to maturity. The longer the time to maturity, typically the higher the yield, however, the longer maturity also brings more price volatility.
When viewing the price movement of long-term Treasury bonds, you will also find that they are much more volatile. Treasury Bonds are more sensitive to the level of current interest rates, but they are also a safe haven when economic concerns arise. This is often termed a “flight to quality” as investors sell riskier investments and move to the safety of Treasury Bonds.
To test our concept of using High Yield Bonds as the “Canary” use a short term EMA for High Yield Corporate Bonds as the signal. If the High Yield Bond Index is above the short term EMA, we want to own those types of bonds. If the High Yield Bond Index is below the short term EMA, we sell the High Yield Corporate Bonds and buy Treasury Bonds.
What were the results?
Over the last 23.5 years if you simply bought and held an Index of High Yield Corporate Bonds (provided by Lipper) the annualized return was 4.88%. If you did the same with an Index of Long-Term Treasury Bonds (represented by the ETF TLT) the annualized return was 5.25%. However, if you did the work and diligently moved between the two, the annualized return jumps to 14.24%. Clearly, there is a benefit to making the determination as to which type of bond to invest in.

This represents a study by GIS. It does not constitute investment advise or an offer or solicitation to purchase or sell any security and is subject to change at any time due to changes in market or economic conditions. The comments should not be construed as a recommendation of individual holdings or market sectors, but as an illustration of broader themes. Data is from what we believe to be reliable sources, but it cannot be guaranteed. GIS assumes no responsibility for the accuracy of the data provided by outside sources. No fees are taken out in this data since the table is not representing a managed account, but rather a statistical study.
is the high yield indicator effective for equity investing?
There is no doubt that major stock market declines occur when High Yield Corporate Bonds are below trend lines. Not all ventures below the trend line indicate that a significant decline is underway. The benefit of knowing when the potential is present for a major decline is allowing the way you trade to change from a longer term outlook to a defensive outlook.
Using a combination of indicators and knowing when to adjust the way those indicators are utilized allows a portfolio to reduce volatility and assist in reducing declines. The goal of investors should be to get the best return possible with the lowest amount of risk, having indicators that have illustrated the ability to identify both positive and negative investment climate goes a long way in reaching those goals.